Example of what a data table section might look like. Your section may have additional tables or different information.
However, each lab report section must have a specified Roman numeral, and a section title. Tables should have the table
description written above it and numbered Table1 or Table 2 and so forth. Note that these tables have no text in the
same cells as the numbers. Your measurement units should be written in the row or column headings, not in the cells
with the measurements themselves.
IV. Data
Tables
Table 1. Drops of KIO3
solution in 11 drops of
solution and the times for the reaction to take place
at 3 different temperatures.
|
Well # |
KIO3 drops |
Time
(in s)
at 13°C |
Time
(in s)
at 23°C |
Time
(in s)
at 33°C |
|
1 |
1 |
65 |
49 |
30 |
|
2 |
2 |
35 |
25 |
17 |
|
3 |
3 |
22 |
15 |
12 |
|
4 |
4 |
20 |
12 |
10 |
|
5 |
5 |
15 |
10 |
7 |
|
6 |
6 |
12 |
9 |
6 |
|
7 |
7 |
11 |
8 |
4 |
|
8 |
8 |
10 |
6 |
3 |
|
9 |
9 |
9 |
5 |
3 |
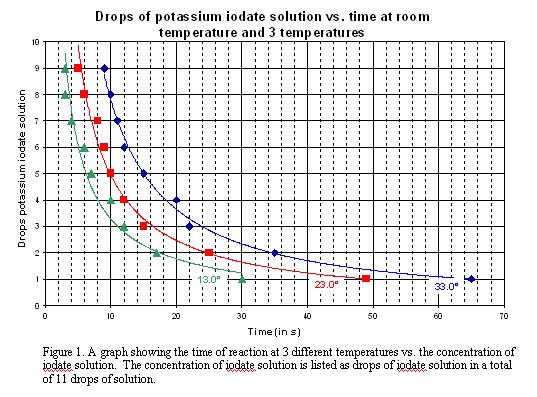
Below is an example of what a graph might look like. Your graph may have different data. However, all
graphs should have the description written under them and should be numbered "Figure1." or "Figure 2." and so forth.
Also, all graphs should have a title centered above it, should have the x and y axes labeled so that anyone
looking at it would know what was being measured, and should have the x and y axes labeled to show the units
of measurement.